- Edukasyon
- ट्रेडिंग रणनीतियाँ
- Aroon इंडिकेटर: ट्रेंड के जीवन चक्र को ट्रैक करना
Aroon इंडिकेटर: ट्रेंड के जीवन चक्र को ट्रैक करना
हर बाजार की चाल का एक रिद्म होता है — शुरुआत, तेजी और अंत में धीमापन। Aroon इंडिकेटर ट्रेडर्स को यह समझने में मदद करता है कि ट्रेंड इस चक्र के किस चरण में है। यह इस बात को मापता है कि कीमत ने हाल ही में कब नया हाई या लो बनाया है, जिससे यह पता चलता है कि ट्रेंड मजबूत हो रहा है या कमजोर — अक्सर चार्ट पर साफ दिखने से पहले ही।
- Aroon इंडिकेटर क्या मापता है
- डेटा कैसे पढ़ें
- ट्रेडर्स Aroon का उपयोग कैसे करते हैं
- Aroon इंडिकेटर की ताकत और सीमाएं
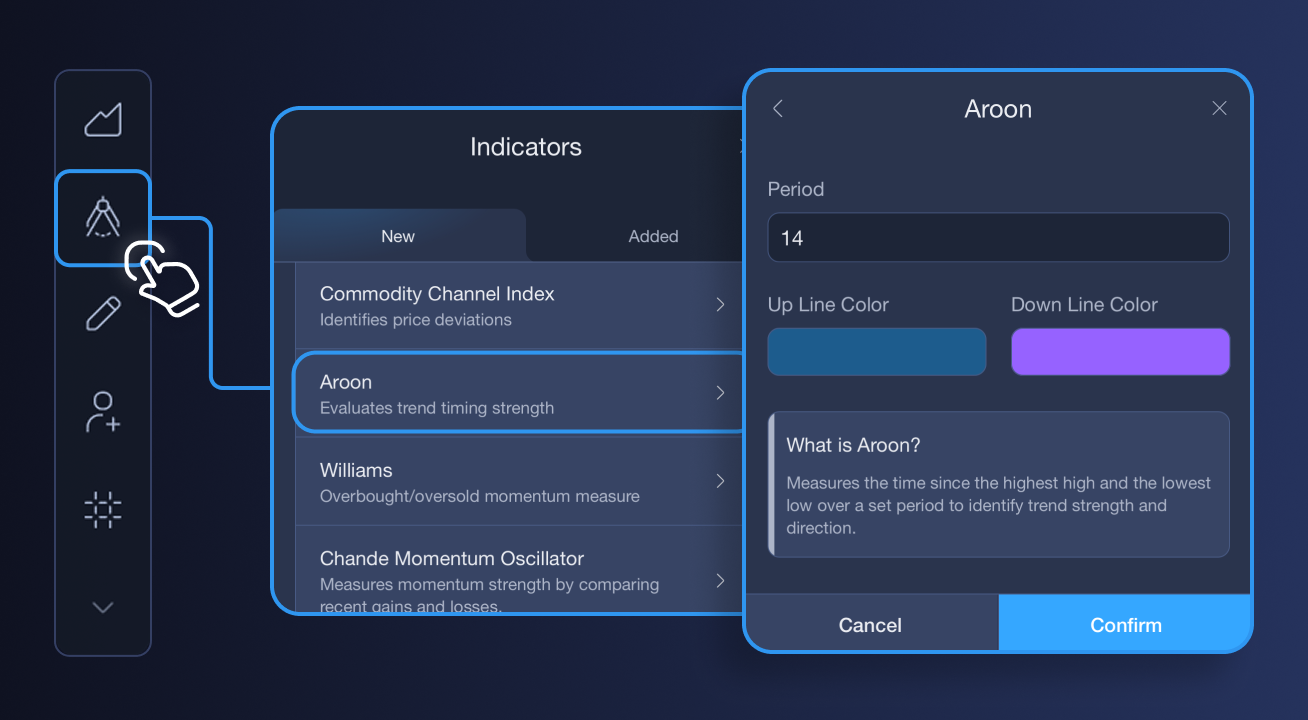
Aroon इंडिकेटर क्या मापता है
Aroon दो लाइनों से बना होता है जो 0 से 100 के बीच मूव करती हैं:
- Aroon Up: यह मापता है कि हाल ही में हाई बनने के बाद कितना समय बीत चुका है।
- Aroon Down: यह मापता है कि हाल ही में लो बनने के बाद कितना समय बीत चुका है।
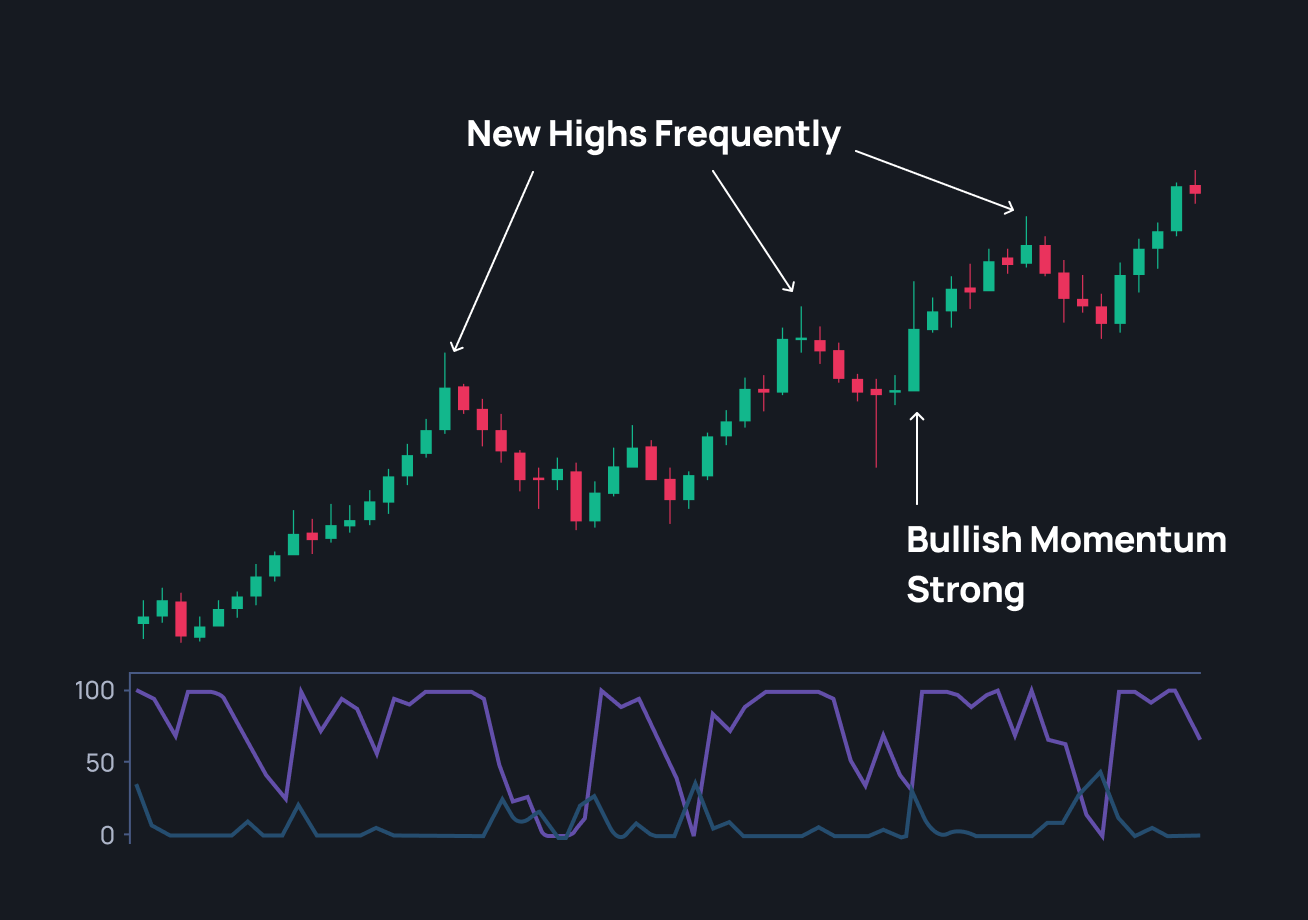
जब Aroon Up 100 के करीब रहता है, तो बाजार लगातार नए हाई बना रहा होता है — यह मजबूत अपट्रेंड का संकेत है। जब Aroon Down 100 के करीब होता है, तो इसका उल्टा होता है — सेलर्स का दबदबा होता है।
इन दोनों लाइनों का संबंध बताता है कि बाजार ट्रेंड में है, कमजोर हो रहा है या साइडवेज चल रहा है।
डेटा कैसे पढ़ें
Aroon Up और Aroon Down के इंटरैक्शन को समझना बहुत जरूरी है:
- मजबूत अपट्रेंड: Aroon Up 100 के करीब, Aroon Down 0 के करीब
- मजबूत डाउनट्रेंड: Aroon Down 100 के करीब, Aroon Up 0 के करीब
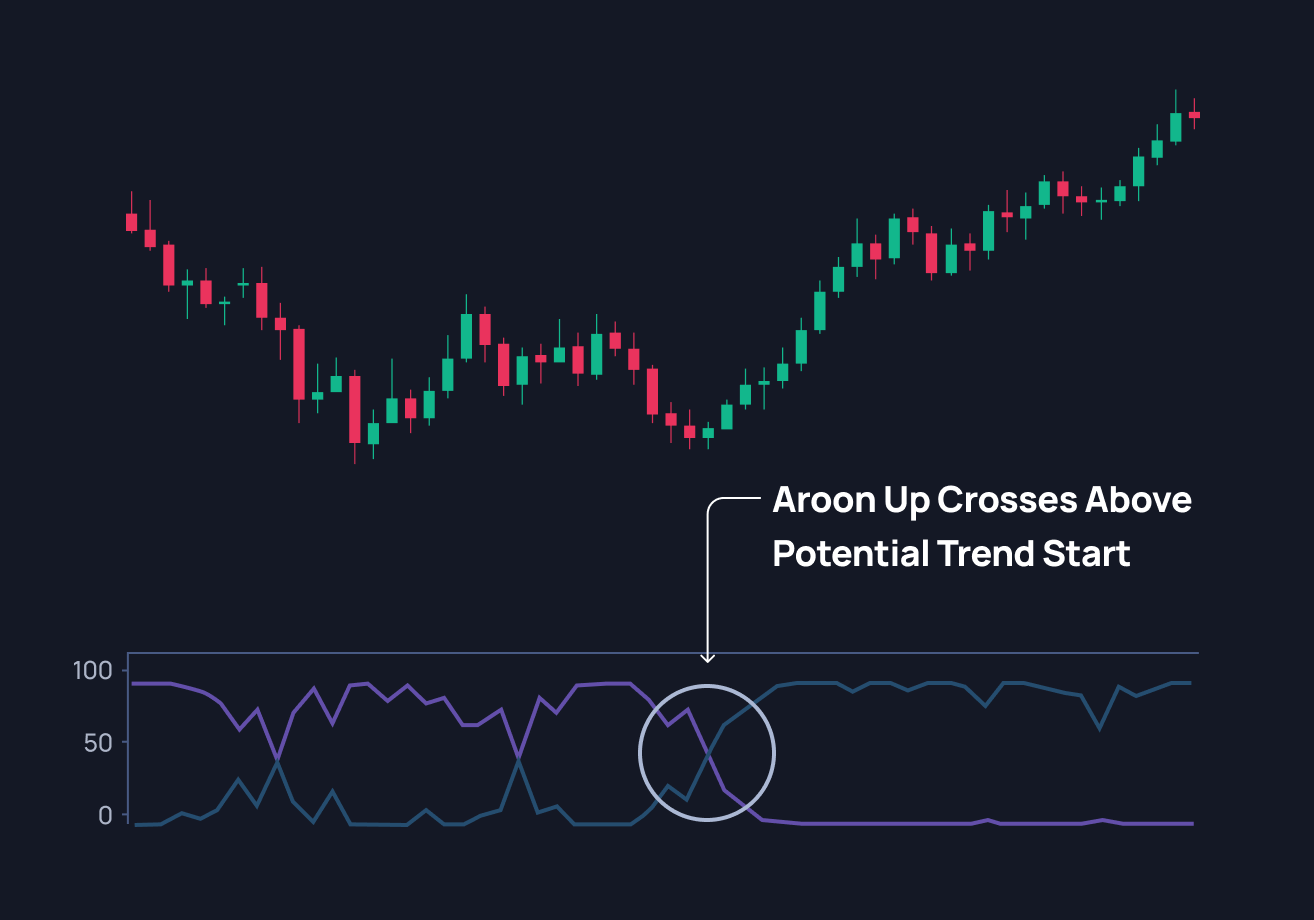
- क्रॉसओवर: जब Aroon Up, Aroon Down को ऊपर से क्रॉस करता है, तो यह नए अपट्रेंड का संकेत हो सकता है। उल्टा होने पर डाउनट्रेंड का संकेत मिलता है।
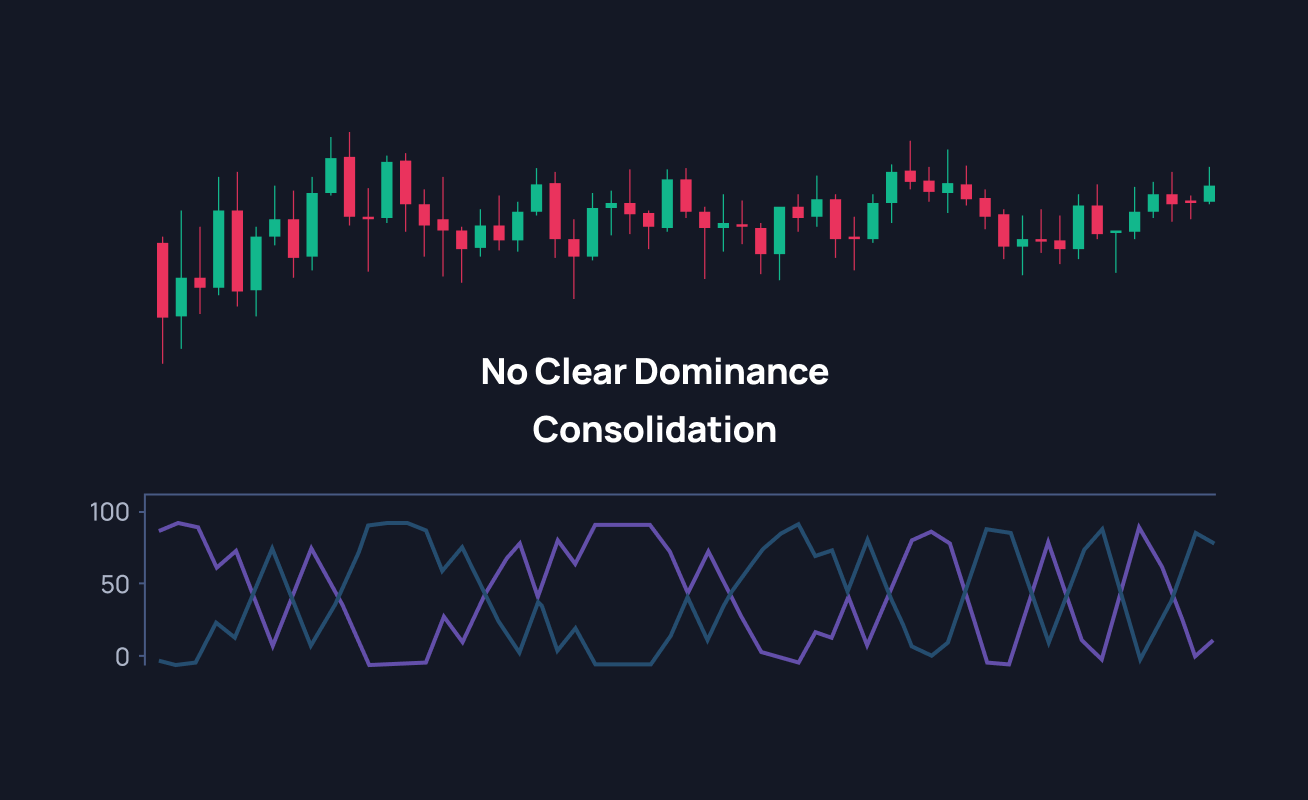
- दोनों 50 के करीब: यह दर्शाता है कि बाजार साइडवेज है या कोई स्पष्ट दिशा नहीं है।
कई प्राइस-बेस्ड इंडिकेटर्स के विपरीत, Aroon “समय” पर ध्यान देता है — हाल ही में हाई या लो कब बने, इसके आधार पर ट्रेंड की ताकत को मापता है।
ट्रेडर्स Aroon का उपयोग कैसे करते हैं
1. नए ट्रेंड को पकड़ना
जब Aroon Up, Aroon Down को ऊपर की ओर क्रॉस करता है और उच्च स्तर पर रहता है, तो यह दिखाता है कि खरीदार लगातार कीमत को ऊपर धकेल रहे हैं। ट्रेडर्स इसे शुरुआती अपट्रेंड के रूप में देखते हैं।
2. ट्रेंड की कमजोरी पहचानना
जब दोनों लाइनें 50 के आसपास आ जाती हैं, तो इसका मतलब होता है कि मोमेंटम कमजोर हो रहा है और बाजार कंसोलिडेशन में जा सकता है।
3. रिवर्सल की पुष्टि
लंबे अपट्रेंड के बाद अगर Aroon Down, Aroon Up को ऊपर की ओर क्रॉस करता है और उच्च स्तर पर रहता है, तो यह डाउनट्रेंड की शुरुआती चेतावनी हो सकती है।
Aroon इंडिकेटर की ताकत और सीमाएं
ट्रेडर्स को Aroon इसलिए पसंद है क्योंकि यह स्पष्ट और सरल है। यह बिना जटिल व्याख्या के ट्रेंड की ताकत दिखाता है। सही तरीके से इस्तेमाल करने पर यह आपको बाजार की मुख्य दिशा के साथ रहने में मदद करता है और कमजोर मोमेंटम में एंट्री से बचाता है।
- ट्रेंड की ताकत में बदलाव की शुरुआती जानकारी देता है
- मोमेंटम बढ़ रहा है या घट रहा है, यह स्पष्ट दिखाता है
- अलग-अलग टाइमफ्रेम में उपयोगी (शॉर्ट टर्म और स्विंग ट्रेडिंग)
हालांकि, Aroon इंडिकेटर पूरी तरह परफेक्ट नहीं है:
- साइडवेज या चॉपी मार्केट में गलत संकेत दे सकता है
- तेज रिवर्सल या बड़े मूव के बाद थोड़ा लेट हो सकता है
यह इंडिकेटर तब सबसे अच्छा काम करता है जब इसे अन्य कन्फर्मेशन टूल्स के साथ इस्तेमाल किया जाए, जैसे:
- Moving Averages: पूरे ट्रेंड की दिशा को कन्फर्म करता है
- ADX (Average Directional Index): ट्रेंड की ताकत मापकर कमजोर सिग्नल को फिल्टर करता है
- RSI (Relative Strength Index): ओवरबॉट और ओवरसोल्ड स्थितियों को पहचानता है
इन टूल्स को साथ मिलाकर उपयोग करने से यह समझने में मदद मिलती है कि Aroon असली मार्केट स्ट्रेंथ दिखा रहा है या सिर्फ शॉर्ट-टर्म नॉइज़।
Aroon इंडिकेटर ट्रेंड की ताकत को स्पष्ट रूप से दिखाता है — सिर्फ दिशा नहीं, बल्कि यह भी कि उसमें कितनी एनर्जी बची है। हाई और लो के टाइमिंग को ट्रैक करके यह मोमेंटम के बनने, कमजोर होने या पलटने के संकेत देता है।
इसे अपने ट्रेडिंग टूल्स में एक ट्रेंड हेल्थ चेक के रूप में जोड़ें। अन्य इंडिकेटर्स के साथ मिलाकर यह आपको जल्दी एंट्री, बेहतर एग्जिट और ज्यादा आत्मविश्वास के साथ ट्रेड करने में मदद कर सकता है।